What is the real housing inflation in Tehran?
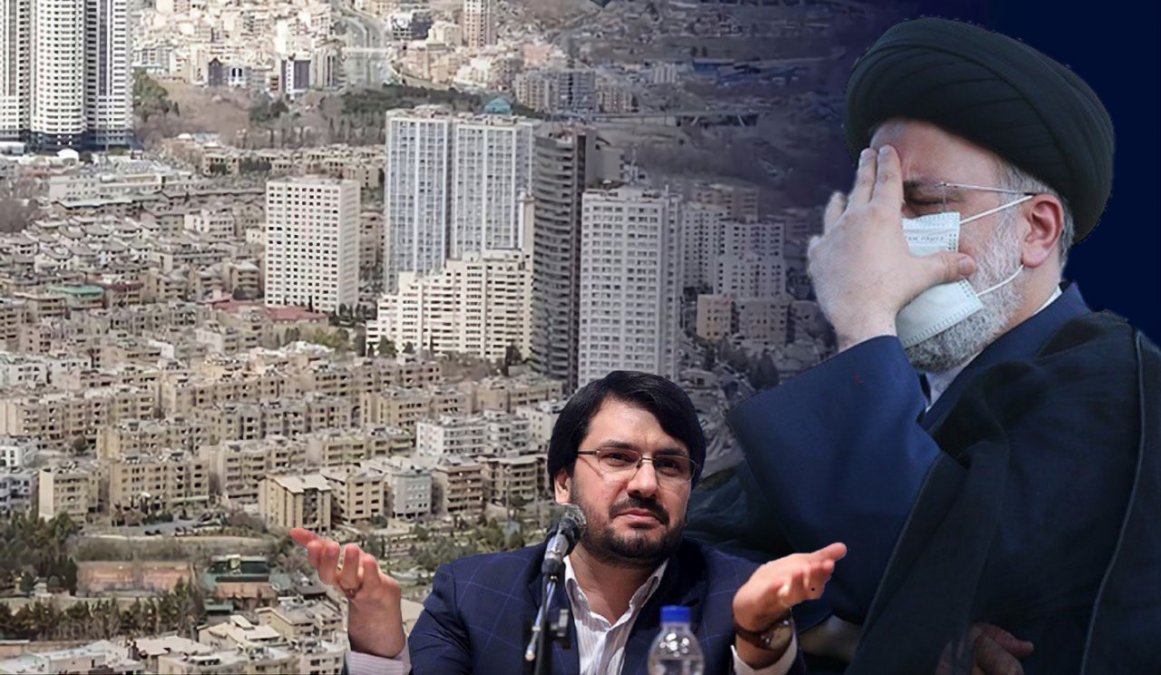
What is the real housing inflation in Tehran? According to Iran Gate, the government’s secrecy under Raisi in releasing statistics related to housing inflation and average prices in Tehran and the country has intensified ambiguities in the housing market. These ambiguities have caused tension in the market, leading to an unimaginable increase in prices. Now, statistics published in the media indicate a more than 100% increase in prices over the past year.
According to statistics published by domestic media, it seems that the point-to-point housing inflation in April 2022 was more than 100%. The current state of the housing market also indicates an unprecedented rise in rental rates, and this trend seems likely to continue. Meanwhile, the Central Bank, which is responsible for publishing statistics related to the housing market, has refrained from doing so for over five months. Experts believe that the government and the Central Bank have decided to combat inflation and rising prices with a strategy of secrecy.
Iran Gate, in a two-part report, has examined the housing inflation report and reflected experts’ analyses in this file. In the first part of this report, the mentioned report has been expanded and elaborated, which is further discussed.
What is the real housing inflation?
According to statistics published by the Farda Economy website, the point-to-point housing inflation rate in Tehran province was more than 100%. In other words, housing prices in Tehran province doubled over the one-year period from April 2021 to April 2022.
However, the published statistics highlight very important points that will warn of worsening living conditions for the people. This is while the Raisi government had promised to not only control housing inflation but also reduce prices by producing more than 4 million housing units during the 4-year presidential term.
As mentioned, this report includes many concerning points that should be addressed by the government and other governing bodies. The Parliamentary Research Center had also published similar reports in recent months, which had not received as much attention. However, the government’s and Central Bank’s secrecy in releasing statistics has made the recent reports by non-governmental media more prominent.
According to these statistics, Mahmoudieh neighborhood in Tehran tops the list of the most expensive areas, with over 167 million tomans per square meter. The title of the cheapest area in the capital belongs to the Fath and Seventeenth Shahrivar districts, where each square meter was traded for about 18 million tomans in April 2022.
The highest housing inflation belongs to the poor areas of Tehran.
Statistical data analysis shows that not only is the housing inflation rate in the poor neighborhoods of the capital higher than other areas, but the housing rate in suburban townships with minimal living facilities tops the housing inflation chart in Tehran province. According to this report, the point-to-point housing inflation rate in April 2021 for suburban townships around Tehran was more than 150%. In other words, housing prices in areas like Robat Karim, Shahr-e Rey, and Parand Township have more than doubled compared to April 2021.
This means that the poor classes residing in the townships around Tehran have purchased housing at more than 50% higher than the average areas of Tehran. This point carries very important messages, the analysis of which can open multiple doors in economic analysis for experts. Among the most important of these messages is the warning of a rush by the middle class and middle-income deciles of the capital to purchase housing in Tehran’s suburban townships.
A look at housing inflation in other areas of Tehran also shows that almost all areas with inflation rates higher than the average inflation in the capital are from the poor neighborhoods of Tehran. On the other hand, the lowest housing inflation rate in the past year pertains to the ultra-luxurious areas of Tehran, which could mean a decrease in demand for housing in these areas.
In the next part, a more detailed analysis of the detailed statistics and figures of this report is addressed. The data related to the housing inflation rate in the 22 districts of Tehran is also published separately in the second part of this report.
English
View this article in English

